SMBs have access to more business data than ever before. Website analytics, advertising platforms, CRMs, accounting systems, email software, customer service tools, and sales reports can all produce large amounts of information about what is happening across the company.
The challenge is not collecting the data. The challenge is knowing which numbers deserve attention.
That is where the difference between a metric and a KPI becomes important.
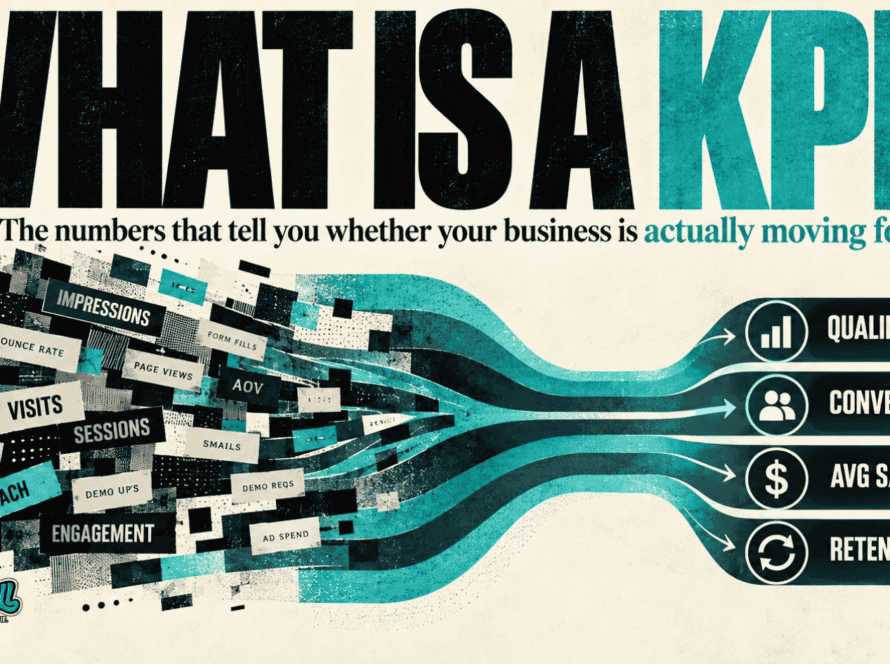
The two terms are often used interchangeably, but they serve different purposes. A metric is any measurable value that tells you something about an activity, process, or result. A KPI, or key performance indicator, is a metric that has been tied to an important business objective.
That distinction matters because a business can track hundreds of metrics and still have very little clarity about whether it is actually improving.
What Is a Metric?
A metric is simply a measurement.
Website traffic is a metric. Ad clicks are a metric. Sales calls, email opens, customer reviews, form submissions, proposal volume, and average order value are all metrics.
Metrics help describe what is happening inside the business. They can show changes in activity, behavior, efficiency, or performance, and they are often useful when a company is trying to understand why something changed.
The mistake is assuming that every useful metric should automatically become a KPI.
Consider website traffic. If a company receives 10,000 visitors one month and 15,000 the next, traffic has increased by 50 percent. That may be useful information, but it does not tell the owner whether the website is contributing more to the business.
If the site generated 400 leads from those 10,000 visitors and only 350 leads from the 15,000 visitors the following month, the traffic increase looks very different. The company attracted more people, but it generated fewer opportunities.
Website traffic still matters because it helps explain the situation, but it may not be the number that deserves the most attention.
What Is a KPI?
A KPI is a metric that has been identified as especially important because it reflects progress toward a business goal.
The word “key” is what separates a KPI from an ordinary metric.
If a company is trying to improve sales efficiency, qualified-lead-to-sale conversion may become a KPI. If the goal is to acquire customers more profitably, customer acquisition cost may become one. If the business is focused on customer loyalty, retention or repeat purchase rate may deserve KPI status.
The measurement itself does not become more important because it appears on a dashboard. It becomes important because the business has connected it to an objective.
This is also why KPIs can change over time.
A company may spend several months focused on improving sales conversion. Once that problem is under control, retention or average sale value may become more important. The old metrics do not disappear, but the company’s attention moves to a different part of the business.
That is one reason copying another company’s KPI list is rarely very useful. Two businesses in the same industry can need very different KPIs depending on what each one is trying to improve.
KPI vs. Metric in Practice
The easiest way to understand the difference is to look at how the numbers are used.
Imagine an SMB running paid advertising. The campaign produces more impressions, more clicks, and a lower cost per click than the previous month. On the surface, the campaign looks healthier.
Now imagine that the cost to acquire an actual customer increased during the same period.
The ad platform can accurately report that clicks became cheaper. The business can also accurately say that acquiring customers became more expensive.
Both numbers are useful, but they answer different questions.
Cost per click is a metric that helps describe what is happening inside the campaign. Customer acquisition cost may be the KPI because it is more closely connected to the business outcome.
The same thing happens in sales. A team may increase call volume and send more follow-up emails while closing fewer customers. Activity increased, but performance declined.
Call volume is useful because it provides context. Qualified-lead conversion may be the KPI because it tells the company whether the sales process is producing the desired result.
Metrics explain the activity. KPIs help determine whether that activity is working.
Why SMB Dashboards Become So Noisy
One of the biggest reasons businesses struggle with KPIs is that every software platform reports its own version of performance.
Google Ads reports what happens inside Google Ads. Google Analytics reports what happens on the website. A CRM reports what happens inside the sales pipeline. Email software reports campaign engagement. Accounting software reports financial results.
Each system can provide valuable information, but none of them automatically sees the entire business.
A real customer might click an ad, visit the website, submit a form, talk to a salesperson, make a purchase, contact customer service, leave a review, and buy again several months later.
From the customer’s perspective, that is one journey.
From the company’s software stack, it may appear as a series of disconnected events across several platforms.
This is how an SMB can end up with multiple dashboards that all appear positive while the owner is still wondering why revenue is flat or profitability is declining.
The numbers may be accurate. They are simply being viewed in isolation.
A KPI framework helps bring those measurements back into the context of the business as a whole.
Metrics Are Most Useful When a KPI Changes
KPIs and metrics should not compete with each other. They work best as different layers of the same reporting system.
KPIs tell the business where to look. Metrics help explain what is happening underneath.
Suppose a company monitors qualified-lead-to-sale conversion and notices that it falls from 28 percent to 19 percent. That change is significant enough to deserve attention.
The business can then investigate the supporting metrics around it. Response time may have increased. The source of the leads may have changed. Salespeople may be following up fewer times. Proposal rates may have fallen. One salesperson may be struggling while the rest of the team remains stable.
The KPI tells leadership that something changed. The metrics help determine why.
The same principle applies to customer acquisition cost. If acquisition cost rises sharply, the company can look at cost per click, website conversion, lead quality, close rate, average sale value, and other supporting metrics to identify where the problem began.
This hierarchy is much more useful than putting every measurement on the same level and asking the owner to interpret all of it at once.
Vanity Metrics Need Context
Some metrics are particularly easy to overvalue because they look impressive.
Traffic, impressions, followers, reach, subscribers, engagement, and total leads can all create a sense that the business is growing. Sometimes they reflect real progress. Sometimes they do not.
An SMB can double its website traffic without generating more customers. It can increase lead volume while lead quality gets worse. It can grow social reach while sales remain unchanged. It can even increase revenue while margins decline enough to make the business less profitable.
None of those measurements are useless. The problem comes when they are treated as proof of success without being connected to the larger outcome.
This happens frequently when departments report their own performance separately.
Marketing may show that lead volume increased. Sales may report that close rates declined. Operations may already be at capacity. Customer service may be dealing with longer response times.
Each department can be technically correct while the business as a whole becomes less efficient.
A useful KPI system helps connect those pieces so the company is not optimizing one department at the expense of another.
KPIs Should Follow the Customer Journey
One of the most useful ways to organize KPIs is around the customer journey instead of around individual software platforms.
At the beginning of the journey, the company may care about qualified traffic or the cost of generating a real prospect. As visitors become leads, lead conversion and cost per qualified lead may become more important.
During the sales process, close rate, average sale value, or sales cycle length may become useful indicators. After the purchase, retention, repeat purchase rate, referrals, reviews, or customer lifetime value may matter more.
The exact KPIs will depend on the business, but the approach creates a more connected view of performance.
Instead of asking whether the advertising platform looks healthy or whether the CRM numbers look good, the company can ask where the customer journey is improving and where it is breaking down.
That is usually a much more useful question.
A Business Does Not Need Fewer Metrics. It Needs Better Hierarchy.
The answer is not to stop collecting detailed data.
Supporting metrics are valuable because they give the business the detail needed to diagnose a problem once it appears.
The goal is to separate the measurements that leadership should watch closely from the measurements that become useful during deeper analysis.
At the top are the KPIs connected to important objectives. Underneath them are the supporting metrics that help explain movement in those KPIs.
That structure keeps the business informed without overwhelming decision-makers.
The owner does not need to watch every advertising metric every day. If customer acquisition cost suddenly rises, those advertising metrics become important.
The owner does not need to monitor every sales activity number constantly. If close rate falls, the underlying sales metrics become useful.
This is the relationship between KPIs and metrics.
Metrics provide detail. KPIs provide focus.
The Difference Is Really About Decision-Making
The difference between a metric and a KPI may seem like a small reporting distinction, but it affects how a business understands itself.
A company with hundreds of metrics and no clear KPIs may have plenty of information but very little direction.
A company that tracks only a handful of KPIs without supporting metrics may know that something changed but have no idea why.
The strongest reporting systems use both.
They connect business objectives to a small number of important indicators, then keep the supporting data available for deeper analysis when those indicators change.
For SMBs, the goal should not be to measure everything with equal intensity. Most businesses already have more data than they can realistically use.
The goal is to know which numbers deserve attention, understand what is driving them, and connect those changes back to what is happening across the business.
That is when reporting becomes more than a dashboard.
It becomes a decision-making tool.
Find what’s holding you back.