Most small businesses do not have a shortage of data. They have the opposite problem.
Website analytics, ad platforms, CRM systems, accounting software, email tools, call tracking, sales reports, and customer service platforms can all produce dozens or even hundreds of numbers. The challenge is figuring out which of those numbers actually matter.
That is where key performance indicators, or KPIs, come in.
A KPI is a measurement used to show whether a business is making progress toward an important objective. Instead of tracking every number available, KPIs help narrow attention to the measurements that are most closely connected to what the business is trying to accomplish.
For a small business owner, that distinction matters. More reporting does not automatically create more clarity. A dashboard can contain twenty charts and still fail to answer the most important question: is the business actually moving in the right direction?
What Does KPI Stand For?
KPI stands for key performance indicator.
The important word is not “indicator.” It is “key.”
A business may track hundreds of metrics, but only a smaller group should be considered KPIs. These are the measurements that provide meaningful evidence about whether an important part of the business is performing as expected.
For example, a landscaping company might track website visitors, Google Ads clicks, phone calls, estimates completed, jobs won, average project value, labor costs, customer reviews, and repeat customers. Every one of those numbers may be useful, but they do not all deserve equal attention.
If the company’s goal is to grow revenue from residential projects, the owner may care much more about qualified leads, estimate-to-sale conversion rate, average job value, and gross margin than raw website traffic.
A useful KPI connects a number to an actual business objective.
Why KPIs Matter for Small Businesses
Small businesses often operate with limited time, limited staff, and limited attention. Owners and managers may be responsible for sales, marketing, operations, hiring, customer service, finances, and dozens of day-to-day decisions at the same time.
That makes prioritization especially important.
KPIs provide a way to reduce a complicated business into a manageable group of indicators. They can help owners understand whether growth is improving, whether sales performance is changing, whether customer acquisition is becoming more expensive, or whether operational issues are beginning to affect revenue.
The goal is not to monitor everything constantly. The goal is to identify the measurements that deserve attention because they can reveal meaningful changes in the business.
This is also why simply copying another company’s KPI list is rarely useful. The right KPIs depend on the business model, current goals, customer journey, and problems the company is trying to solve.
A roofing company, ecommerce store, medical practice, auto shop, and professional services firm may all use completely different KPI sets even if they generate similar revenue.
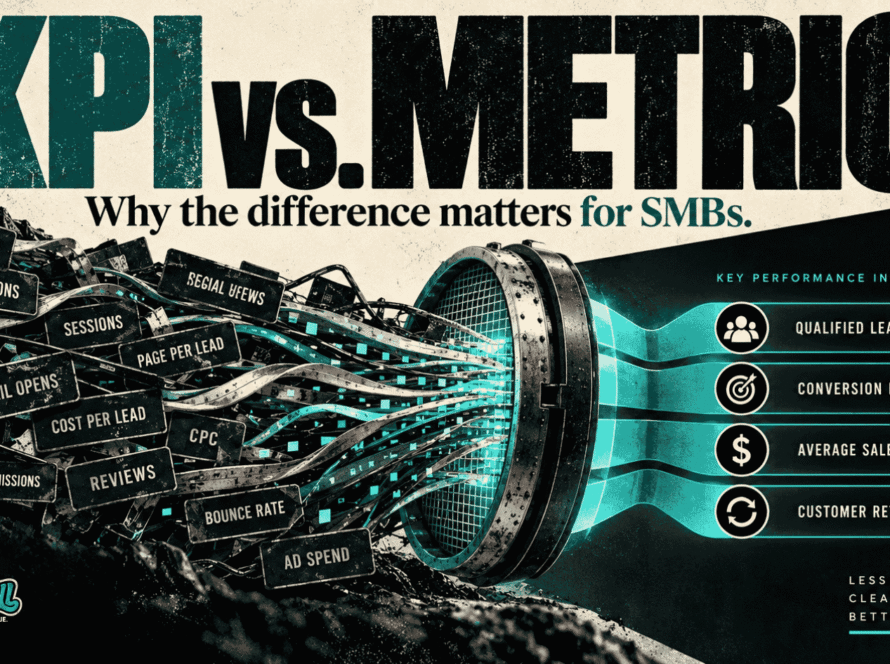
KPI vs. Metric: What Is the Difference?
KPIs and metrics are closely related, but they are not exactly the same thing.
A metric is any measurement that provides information about an activity or result. A KPI is a metric that has been identified as especially important because it is connected to a specific business objective.
For example, website traffic is a metric. It tells you how many people visited the website.
Website conversion rate may become a KPI if generating more leads from existing traffic is an important business objective.
The same distinction applies across the rest of the business.
A sales team may track the number of calls made, emails sent, proposals created, leads contacted, and meetings completed. Those are all metrics. If the company is trying to improve sales efficiency, qualified-lead-to-sale conversion rate may be the KPI that deserves the most attention.
The difference is not really about the number itself. It is about the role that number plays in the business.
We cover this distinction in more detail in our guide to KPIs vs. metrics, including practical examples of when a normal metric becomes a meaningful performance indicator.
What Makes a Good KPI?
A useful KPI should help someone understand whether an important part of the business is improving, declining, or staying roughly the same.
That sounds obvious, but many dashboards are filled with measurements that are easy to collect rather than measurements that are genuinely useful.
A good KPI should normally be connected to a clear objective, measured consistently, easy enough to understand, and capable of influencing a business decision.
For example, imagine a company spends heavily on paid advertising. Tracking impressions and clicks may provide useful context, but neither number tells the owner whether those ads are generating profitable customers.
A more meaningful KPI could be customer acquisition cost, qualified lead cost, or revenue generated from paid campaigns.
The exact KPI depends on what the business is trying to understand.
One useful way to evaluate a KPI is to ask four questions:
- Does this measurement connect to an important business objective?
- Would a meaningful change in this number deserve attention?
- Can we influence this number through business decisions?
- Does this measurement help us decide what to investigate or change?
If the answer to all four is no, the metric may still be useful, but it probably does not belong at the top of the dashboard.
Leading and Lagging KPIs
KPIs can also be divided into leading and lagging indicators.
Lagging KPIs measure results that have already happened. Revenue, profit, closed sales, retention, and customer lifetime value are common examples.
These indicators are extremely important because they show the final result of business activity. The limitation is that by the time a lagging indicator changes, the underlying cause may have started weeks or months earlier.
Leading KPIs provide earlier evidence that future results may be changing.
For a sales organization, this might include qualified leads, scheduled appointments, proposal acceptance rate, or pipeline velocity. For an ecommerce business, it might include product page conversion, cart completion, or repeat purchase behavior.
A healthy KPI system usually includes both.
Lagging indicators tell you where the business ended up. Leading indicators can help you understand where it may be heading.
This becomes especially important for small businesses because waiting until monthly revenue drops can make problems more difficult to diagnose. If the business is also watching the stages that lead to revenue, it may be possible to recognize a change earlier.
Examples of Small Business KPIs
There is no universal list of KPIs every small business should track. The right measurements depend on how the company attracts customers, sells, delivers its product or service, and earns revenue.
That said, there are several common categories that are useful across many businesses.
Marketing KPIs
Marketing KPIs help measure whether marketing activity is generating useful business outcomes.
Common examples include customer acquisition cost, qualified leads, cost per qualified lead, marketing-sourced revenue, and landing page conversion rate.
The important distinction is between activity and outcome.
A marketing team can increase traffic, impressions, clicks, and engagement while the business generates the same number of customers. That does not necessarily mean the marketing failed, but it does mean those activity metrics need to be viewed in context.
For many small businesses, the more useful question is not “Did traffic increase?” but “Did the increase produce more qualified opportunities or customers?”
Website KPIs
A company website can generate dozens of measurements, including sessions, users, page views, bounce rate, engagement time, traffic sources, and device types.
Some of those numbers are useful for analysis, but they may not all need to become KPIs.
If the website’s purpose is to generate leads, visitor-to-lead conversion rate may be more important than total traffic. If the business sells products online, checkout conversion or revenue per visitor may deserve more attention.
The website KPI should reflect what the website is supposed to accomplish.
Sales KPIs
Sales KPIs help measure how effectively opportunities move through the sales process.
Common examples include lead-to-sale conversion rate, average sale value, sales cycle length, proposal acceptance rate, and revenue per salesperson.
The best sales KPI often depends on where the company is experiencing friction.
A business with plenty of leads but weak revenue growth may have a conversion problem. A company with a strong close rate but declining revenue may instead need to investigate lead volume, pricing, average order value, or customer retention.
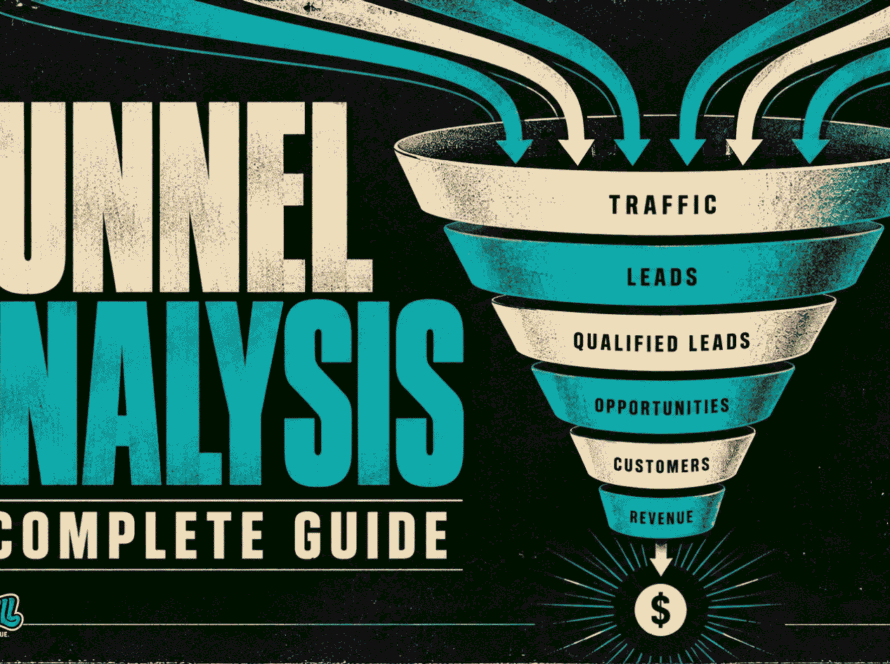
Looking at the entire funnel prevents one metric from being interpreted in isolation.
Customer KPIs
Customer metrics become especially important as a business grows.
Repeat purchase rate, customer retention, lifetime value, referral rate, review volume, and customer satisfaction can all provide information about what happens after the initial sale.
This is an area many small businesses under-measure. A company may invest heavily in acquiring new customers while paying very little attention to whether existing customers return, refer others, or disappear after the first transaction.
Customer KPIs can reveal whether the business is creating durable revenue or constantly replacing customers who leave.
Financial KPIs
Financial KPIs help connect operating activity to the health of the business.
Revenue is the most obvious example, but it should rarely be viewed alone.
Gross margin, operating margin, revenue per customer, cash flow, average transaction value, and customer acquisition cost can provide a much clearer picture of whether growth is actually healthy.
Revenue can increase while profitability declines. Sales can grow while acquisition costs rise even faster. A company can appear busy while its economics quietly get worse.
That is why financial KPIs often need to be considered alongside marketing, sales, and operational KPIs.
How Many KPIs Should a Small Business Track?
There is no perfect number, but the answer is usually fewer than people expect.
The purpose of a KPI dashboard is not to display every measurement available. It is to surface the indicators that deserve regular attention.
A small business may have five to ten core KPIs that leadership watches consistently while individual teams monitor additional supporting metrics.
For example, the owner might watch revenue, gross margin, qualified leads, sales conversion, customer acquisition cost, and repeat purchase rate. The marketing team may monitor another fifteen metrics underneath those numbers to understand what is driving them.
This creates an important distinction between executive visibility and diagnostic detail.
The owner does not necessarily need every number every day. But when a KPI changes, the supporting metrics become useful for understanding why.
The Problem With Tracking KPIs in Silos
One of the biggest mistakes companies make is evaluating each department independently.
Marketing may report that leads increased 40 percent.
Sales may report that conversion declined 20 percent.
Operations may report that the team is already at capacity.
Every report can be technically accurate while telling a completely different story.
Looking only at the marketing report might suggest the company should generate even more leads. Looking at the entire system may reveal that additional leads are actually making the problem worse because sales or operations cannot handle the existing volume effectively.
This is why KPIs become more useful when they are viewed across the customer journey rather than inside individual software platforms or departments.
Website performance affects lead generation. Lead quality affects sales conversion. Sales volume affects operations. Service quality affects reviews and retention. Retention affects customer lifetime value and revenue.
The business is connected even when the reporting systems are not.
The KPI Dashboard Is Not the Strategy
Dashboards are useful because they make important information easier to see.
But a dashboard cannot decide what matters for the business.
A company can spend weeks building sophisticated dashboards and still end up monitoring the wrong numbers. Visualization does not automatically create insight.
The real work happens before the dashboard is built.
What is the company trying to accomplish?
Which stages of the customer journey influence that outcome?
Which measurements provide evidence about those stages?
What would cause the business to take action?
Those questions determine whether a KPI system becomes useful or simply becomes another reporting exercise.
How to Choose the Right KPIs for Your Business
A practical way to choose KPIs is to start with the business objective rather than the data.
Suppose the company wants to increase revenue without significantly increasing advertising spend.
That goal immediately narrows the problem.
The business might investigate website conversion, lead quality, sales conversion, average transaction value, repeat purchases, or customer retention.
Now the KPIs are connected to the objective.
The process can be thought of simply:
Business goal → customer journey → KPI → change → result
For example, a company wants to increase revenue. It discovers that plenty of qualified leads are entering the sales pipeline, but too many are disappearing before receiving consistent follow-up.
The company may choose lead follow-up rate or qualified-lead conversion as a KPI, change the sales process, and then measure whether conversion and revenue improve.
The KPI is useful because it connects the problem to the business outcome.
KPIs Should Create Clarity, Not More Reporting
The best KPI system makes a business easier to understand.
It does not require the owner to spend every morning studying dozens of dashboards. It creates a smaller group of measurements that can quickly reveal whether something deserves attention.
Supporting metrics still matter. They provide the detail needed to diagnose what is happening when a KPI changes.
But they should support the decision-making process rather than compete for attention.
Small businesses already generate enormous amounts of data. The advantage does not come from collecting more of it.
The advantage comes from knowing which numbers matter, understanding how they connect, and recognizing when those numbers are telling you that something in the business needs attention.
Your Business Probably Does Not Need More Metrics
Most businesses already have more measurements than they know what to do with.
Google Analytics has metrics. Your CRM has metrics. Your advertising platforms have metrics. Your accounting software has metrics. Your sales team has metrics.
The problem is rarely a lack of numbers.
The problem is deciding which numbers actually explain what is happening between the first customer interaction and the final revenue outcome.
That is where KPIs become valuable.
When the right measurements are connected across marketing, sales, customer experience, and revenue, the business becomes much easier to understand.
And when something starts moving in the wrong direction, you have a much better chance of finding out why.
Find what’s holding you back.