

For many service businesses, a website starts as a digital brochure. It explains what the company does, lists services, shows some photos, and gives visitors a way to contact the business. That is useful, but it often leaves a lot of growth potential untouched because the site is not being treated as part of the customer acquisition system.
In this project, I helped turn a service-based B2C website from a mostly static marketing channel into a measurable acquisition and conversion system. The work combined SEO, conversion optimization, customer journey analysis, and analytics infrastructure so the business could understand not only how people were finding the site, but what they were doing after they arrived and whether that activity was moving them closer to becoming customers.
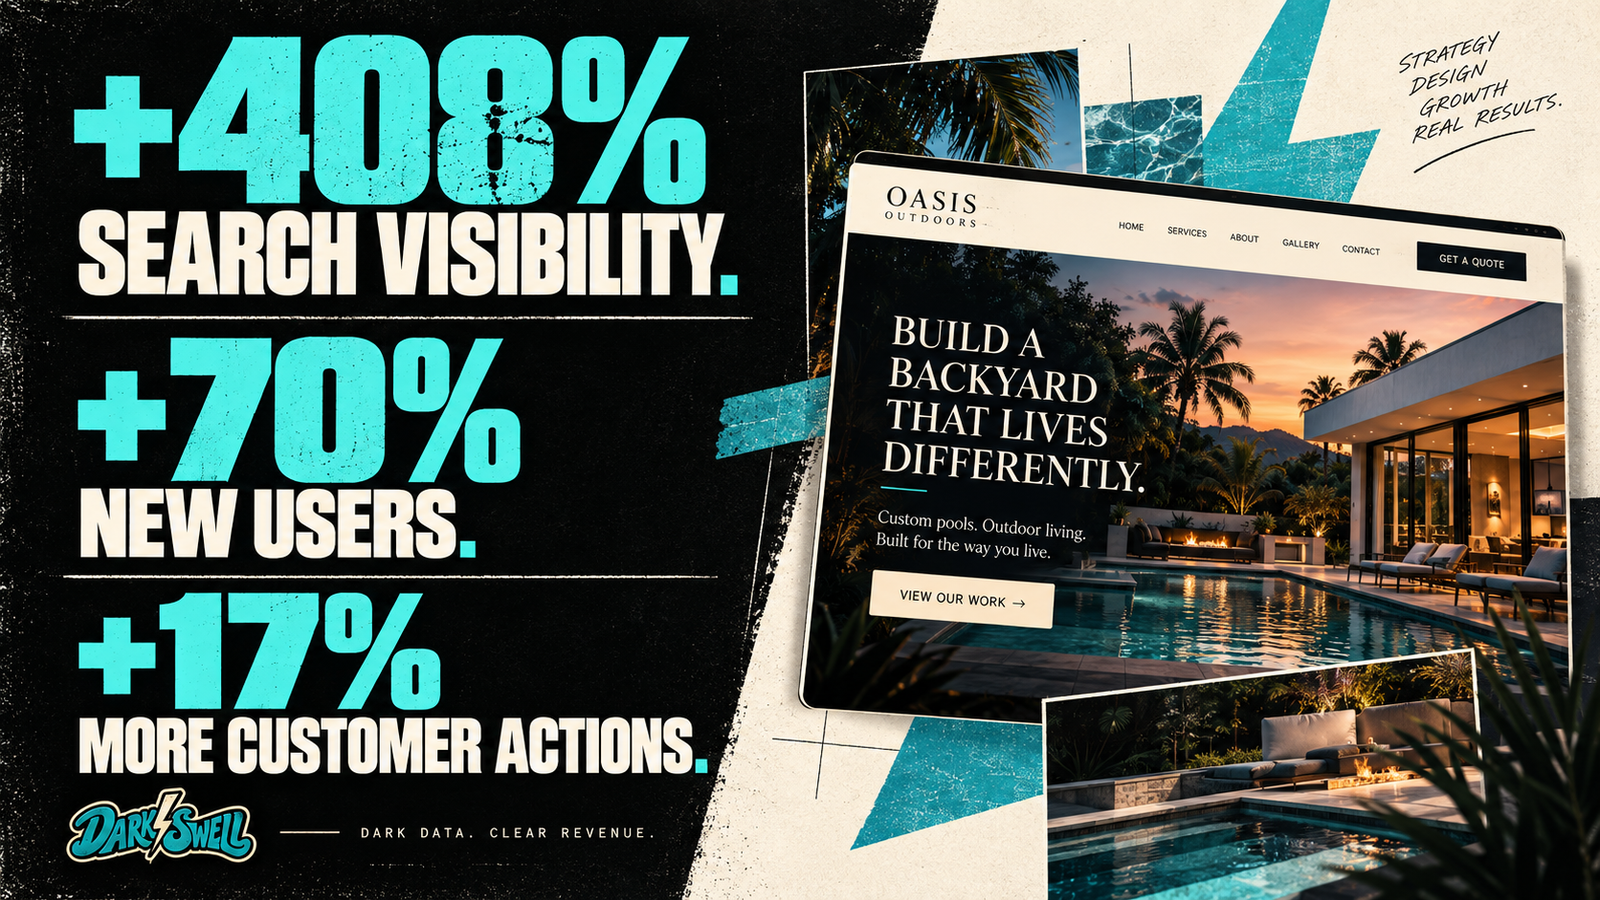
From 2024 to 2025, Google search impressions increased from 354,507 to more than 1.8 million, a 408% increase. New users grew nearly 70%, average engagement time per user increased more than 51%, views of a high-intent service section rose 167%, and views of a primary conversion destination increased from 511 to 19,560. Core customer actions also increased 17% year over year.
The important part was not any single metric. It was the way the metrics moved together. More people were discovering the business, more of those visitors were spending meaningful time on the site, and more were progressing toward the areas connected to real customer activity.
The Website Needed to Do More Than Attract Traffic
A lot of website reporting stops at traffic, rankings, pageviews, clicks, or leads. Those numbers can be useful, but they only describe part of the customer journey. A business can increase traffic substantially and still have no clear understanding of whether those visitors are moving toward a quote, appointment, purchase, registration, or other meaningful action.
That became the focus of the project. Instead of treating SEO, UX, analytics, and conversion tracking as separate marketing tasks, I treated the website as one connected acquisition system. The goal was to make the site easier to find, easier to understand, easier to navigate, and easier to measure.
That meant looking at the website less like a collection of pages and more like a sequence of customer decisions. Search visibility mattered because it created more opportunities to enter the journey. Website structure mattered because it influenced where those visitors went next. Analytics mattered because it made those decisions visible.
Expanding Search Visibility Around Customer Intent
The first part of the work focused on increasing search visibility, but not simply for the sake of ranking for more keywords. The site needed to appear more often for searches connected to the services and actions that actually mattered to the business.
I rewrote core website copy around real search behavior, improved content structure and page hierarchy, created more targeted landing pages, strengthened internal linking, optimized technical page elements, and aligned individual pages more closely with the way customers were searching.
Those changes increased Google search impressions from roughly 355,000 to more than 1.8 million.
As visibility expanded, new users increased from 232,764 to approximately 395,000. That created a much larger pool of potential customers entering the site, but traffic growth alone was not enough. The next question was whether those visitors were actually moving deeper into the business.
Improving the Customer Journey After the Click
Once someone arrives on a website, the quality of the experience determines whether the traffic has any real value. I mapped the customer journey from entry page through the actions that mattered most to the business, looking at where users entered, which service pages they explored, how they moved through the site, where they showed stronger intent, and where they dropped out before taking the next step.
The website flow was then improved to make those next steps clearer and reduce unnecessary friction. That included better page relationships, stronger calls to action, clearer paths between informational and commercial content, and a more deliberate progression toward the areas where customers could take action.
One of the clearest results was the increase in views of a primary conversion destination, which grew from 511 to 19,560. That represented a 3,825% increase.
That was more meaningful than a simple increase in pageviews because it showed that substantially more visitors were reaching the part of the site designed to move them toward a business outcome.
More High-Intent Visitors Reached the Pages That Mattered
Not every page on a website has equal value. Someone reading a general information page may still be early in the decision process, while someone exploring a service page tied directly to a quote, consultation, booking, sale, or inquiry is usually much closer to taking action.
Traffic to one of the site’s most commercially important service sections increased by 167%.
That growth mattered because it showed that the website was attracting more than general awareness. More visitors were reaching areas connected to stronger customer intent.
For one business, that might mean a quote request page. For another, it might be scheduling, pricing, a consultation, an estimate, or a booking flow. The exact action changes from company to company, but the principle is the same: more qualified visitors need to reach the parts of the site where buying decisions actually happen.
Engagement Improved While Traffic Grew
Traffic growth can be misleading if visitor quality declines at the same time. In this case, the opposite happened.
Average engagement time per user increased from 18 minutes and 43 seconds to 28 minutes and 22 seconds, an improvement of more than 51%.
That suggested the increased traffic was not simply creating more shallow visits. Users were spending more time interacting with the site, exploring services, and moving through the customer journey.
The business was reaching more people without sacrificing the quality of that engagement. That mattered because sustainable growth is not just about increasing the number of sessions. It is about increasing the number of useful sessions.
Connecting Search Traffic to Customer Behavior
The strongest downstream business metric increased 17% year over year, representing tens of thousands of additional customer actions.
That was the point where the project moved beyond normal website reporting. Instead of stopping at search, click, and website visit, the measurement system was designed to follow the customer deeper into the journey.
Search visibility could be connected to engagement, high-intent pages, conversion paths, and customer actions. That made it much easier to understand whether the growth in traffic was actually contributing to business activity.
This is the difference between reporting that a website received more traffic and understanding what that additional traffic actually did.
Building the Analytics Infrastructure Behind the Website
A major part of the project was building the measurement system that made those relationships visible.
Google Analytics 4 was structured around meaningful customer behavior rather than relying entirely on default reports. Google Tag Manager was used to track important website interactions and conversion paths. Events were created around high-intent page visits, conversion destination clicks, form activity, key navigation behavior, and progression through the site.
The goal was not to build dashboards for the sake of having dashboards. It was to make the data useful enough to answer real business questions.
Where were new customers coming from? Which pages were moving people closer to conversion? Where were users dropping out? Which services were generating the most interest? Was increased traffic producing more business activity? Which parts of the funnel should be improved next?
Those questions made the analytics valuable because they connected website behavior to decisions the business could actually make.
The Website Became a Connected Growth System
The biggest lesson from the project was that the metrics did not exist independently.
More search visibility created a larger pool of potential customers. More qualified traffic created more opportunities for conversion. Better structure helped people find the right services. Better UX made it easier to take the next step. Better analytics made it possible to see where the customer journey was working and where it was breaking.
The value came from getting those pieces to work together.
The website stopped functioning like a collection of isolated pages and started operating more like a measurable growth system.
The DarkSwell Approach
DarkSwell looks at the relationship between acquisition, customer behavior, conversion, and revenue rather than treating them as separate reporting categories.
The useful question is not simply whether traffic increased. It is what happened because traffic increased. It is not simply whether people visited the website. It is where they went, what they did, and whether those actions moved them closer to becoming customers.
That is the difference between website analytics and revenue analytics.
For this business, the result was 408% more search visibility, nearly 70% more new users, significantly more high-intent traffic, deeper engagement, and 17% more core customer actions.