

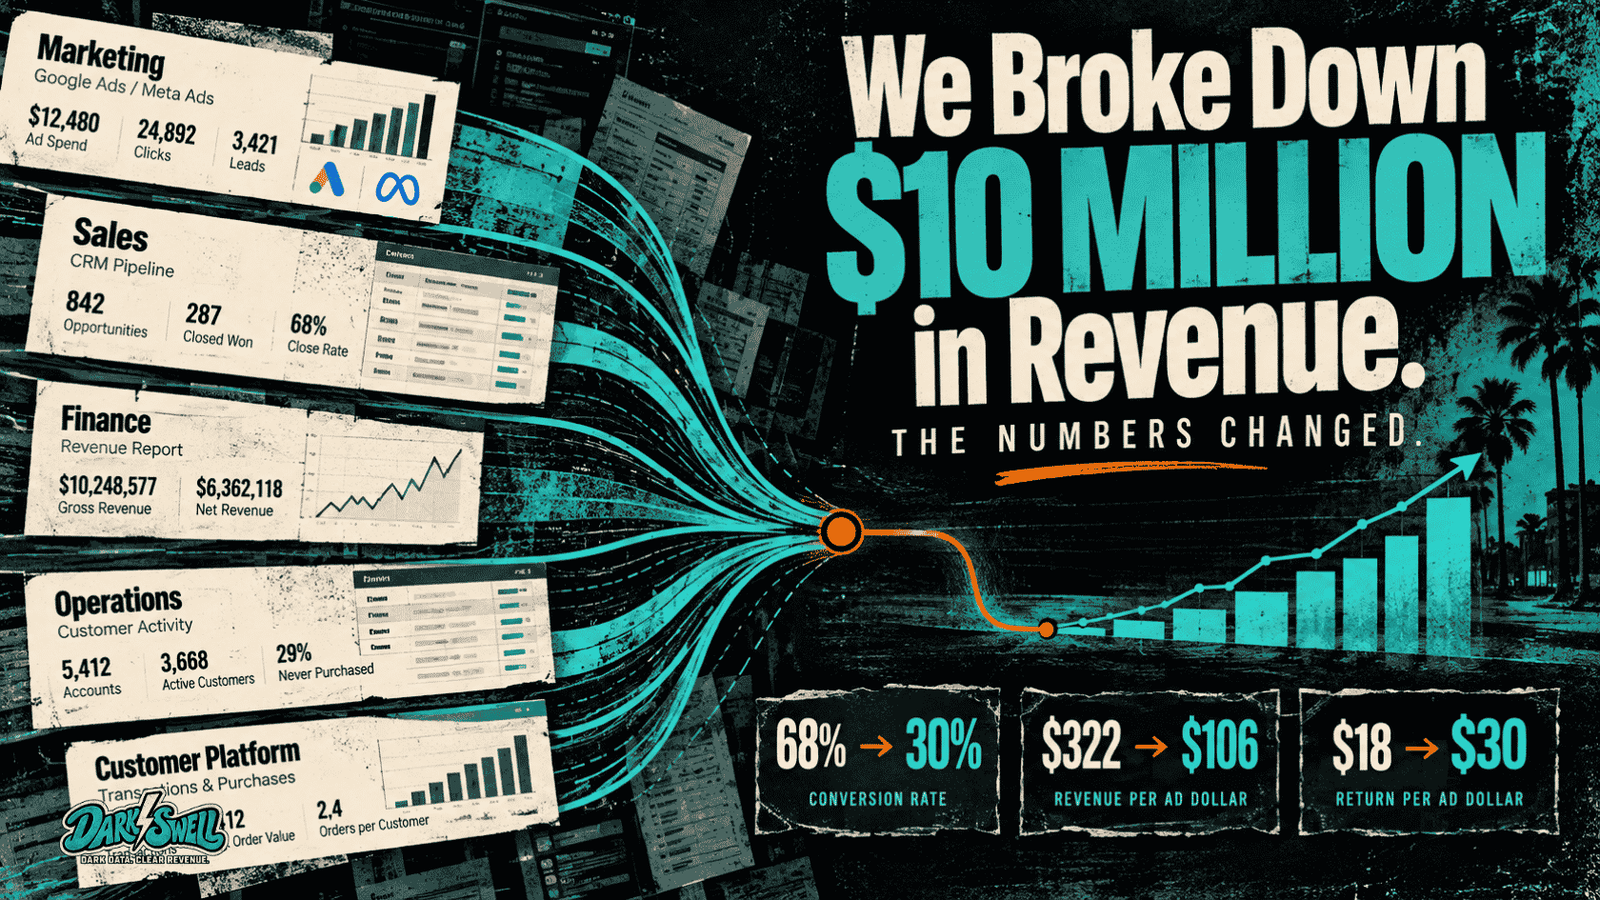
At first glance, the business looked easy to understand. Marketing spend was available. Lead volume was available. Customer activity was available. Revenue was available. The problem was that those numbers lived in different systems, often owned by different parts of the business, and none of them were connected closely enough to explain how one stage led to the next.
That meant an owner or leadership team could easily end up looking at several different reports at once. Marketing had its own view of performance. Sales had another. Finance had another. Operations had another. A customer or transaction platform had another. Each report could be accurate on its own and still fail to explain what was actually driving the business.
Marketing might show more leads. Sales might show more closed business. Finance might show stronger revenue. Operations might show more customer activity. All of those things could be true, but unless the same customer journey connected those reports, leadership was still left trying to answer a much harder question: how did this marketing dollar turn into that revenue?
That was the real issue. The business did not need more reporting. It needed the existing reporting to connect.
Once the data was brought together, several of the numbers changed. Conversion rates that initially looked unusually strong became more realistic. Revenue attributed to advertising shifted depending on which financial measure was used. Customer value changed once transaction history was matched back to acquisition dates. In several cases, the original reports were not technically wrong. They were simply incomplete.
That distinction matters because incomplete data can still produce very confident-looking answers.
The Business Had the Data. It Did Not Have the Story.
Like many established businesses, the company was already collecting a large amount of useful information. Advertising platforms showed spend, campaigns, clicks, and conversions. Lead systems tracked incoming opportunities. Sales records captured contracts or completed deals. Customer platforms stored account activity. Transaction and financial reports showed purchases and revenue.
Individually, each source answered a narrow question. Together, they should have explained the customer journey from acquisition to revenue. The problem was that there was no reliable thread connecting those stages.
A campaign could generate a lead, but that lead was not always tied back to the customer record that followed. A customer could create an account or complete a transaction, but the business could not reliably trace that activity back to the campaign that first brought the person in. Revenue could be measured at the business level, but there was no dependable way to determine which marketing activity contributed to which customer value.
The missing connection was simple in theory: marketing spend should lead to a known lead or customer, that customer should remain identifiable as they move through the sales process, and their eventual transaction value should still be tied back to the source that acquired them.
Without that chain, the business could see activity everywhere while still struggling to explain what caused what.
The full revenue picture goes further.
Marketing was only one layer of the business. A complete view would also look at how acquisition, sales, products, customers, and revenue contribute to growth.
Which channels are actually creating valuable customers?
Where is revenue being won, lost, or concentrated?
Which offers are driving the greatest share of business value?
Which customers are worth the most over time?
The goal is not more reporting. It is a clearer view of what is actually driving revenue.
The First Answer Looked Great. It Was Also Misleading.
One of the clearest examples came from conversion rate.
When the total number of incoming leads was compared with the total number of completed sales, the numbers appeared to suggest a close rate of roughly 68 percent. On the surface, that looked exceptional.
Once the underlying records were matched more carefully, the picture changed. Only a portion of those completed sales had actually originated from the lead source being evaluated. The two reports were measuring different populations, even though placing the totals next to one another made them appear directly related.
The more accurate conversion rate was closer to 30 percent.
Neither report was necessarily incorrect on its own. The problem was the assumption created by combining them without a common customer-level connection. The result looked precise, but the relationship behind it was weak.
That is the kind of mistake that can influence real business decisions. A company could assume its lead quality is unusually strong, decide its sales process does not need attention, or increase spending on a channel that appears to be performing better than it actually is.
Connecting the records replaced that assumption with a more defensible answer.
Revenue Attribution Changed Too.
The same thing happened when advertising spend was compared with revenue.
At a high level, the business appeared to generate approximately $322 in gross revenue for every advertising dollar spent. That was an eye-catching number, but gross revenue was not the most meaningful measure of what the business actually retained.
Once the appropriate revenue figure was used, the return fell to approximately $106 per advertising dollar.
That was still a strong result, but it was a very different business conclusion.
Another customer segment moved in the opposite direction. An early estimate suggested roughly $18 in revenue for every advertising dollar invested. Once customer sign-up dates were connected to actual purchase amounts, the estimate increased to approximately $30 per dollar.
One connection reduced the apparent result. Another increased it. That is exactly why the analysis mattered.
The goal was not to make the numbers look better. The goal was to make them more accurate.
Five Reports Can Still Leave Leadership Guessing.
This is where fragmented data becomes more than an analytics problem. It becomes a leadership problem.
If marketing reports leads, sales reports closed business, finance reports revenue, operations reports customer activity, and another platform reports purchases, the owner or leadership team is left trying to mentally stitch the business together.
That creates a dangerous situation where every department can appear to be performing well while no one can confidently explain what is actually producing growth.
Marketing can say traffic is up. Sales can say contracts are up. Finance can say revenue is up. Operations can say activity is up. Those statements may all be true, but none of them proves how one contributed to the other.
A centralized view does not mean cramming every metric into one giant dashboard. It means connecting the important numbers around the same customer journey so leadership can see how acquisition, conversion, customer value, and revenue relate to one another.
The owner should not have to compare five reports and guess what happened in between them.
Connected Data Changes the Question.
Most businesses already know how much they spend, how many leads they generate, and how much revenue they produce. The harder question is whether they can trace those outcomes to the same customers.
That changes how marketing gets evaluated.
One campaign may generate a large number of inexpensive leads but very little downstream revenue. Another may produce fewer leads but consistently attract higher-value customers. A third may bring in customers who return repeatedly over time.
If the business only looks at cost per lead, the first campaign may appear to be the winner. If it looks at actual customer value, the answer may be very different.
That is the shift from reporting to revenue intelligence. Instead of asking which campaign generated the cheapest lead, the business can ask which campaign generated the most valuable customer.
That is a much more useful question when deciding where the next marketing dollar should go.
Customer Value Does Not End at the First Sale.
Disconnected systems also make it easy to stop measuring customers too early.
Marketing records the lead. Sales records the conversion. Finance records the transaction. Then the analysis ends.
But the customer relationship may continue for months or years. Some customers buy once. Some purchase repeatedly. Some move into higher-value products or services. Others return after long periods of inactivity.
If those later transactions are not connected back to the original acquisition source, the business cannot see the full economic value of the customer.
A customer who generates $500 once and a customer who generates $5,000 over several years may initially look identical if both started as one lead and one sale. Once purchase history is tied back to acquisition data, those customers look very different.
That changes what the business can rationally afford to spend to acquire them.
The Connections Also Revealed Hidden Revenue Opportunities.
The analysis did more than correct existing metrics. It exposed opportunities that were difficult to see when the systems were reviewed separately.
In one part of the customer base, thousands of people had entered the business during the analysis period but never completed a purchase. The business had already spent money to attract them, and those people had already shown enough interest to create an account or otherwise enter the customer ecosystem.
Because registration data and purchase data lived in different places, the size of that dormant audience was not immediately obvious.
Once the systems were connected, that group became a clearly defined reactivation opportunity.
Instead of immediately spending more money to acquire another completely new audience, the business could identify people it had already paid to reach and determine whether those customers could be brought back into the funnel.
That kind of opportunity is easy to miss when every platform is viewed in isolation.
The Gaps Exposed Operational Problems Too.
Connecting the systems also surfaced smaller data issues that could quietly distort performance over time.
Some records were missing. Some dates were inconsistent. Some values had not been entered. In a few cases, what looked like a change in performance was actually a tracking or reporting issue.
Those may sound like minor technical problems, but they affect real decisions. Incomplete data can influence forecasting, sales targets, marketing budgets, staffing, and the way leadership interprets the health of the business.
A dashboard does not make data trustworthy simply because it looks organized.
If the underlying systems are incomplete or disconnected, the dashboard just presents the uncertainty more neatly.
The Fix Is Not Another Dashboard.
The longer-term solution is not to produce another report and add it to the stack. It is to create a cleaner measurement system across the tools the business already uses.
That means making advertising platforms, Google Tag Manager, GA4, forms, the CRM, and the transaction or revenue system share a consistent set of identifiers and attribution data.
Google Ads and Meta can show where the customer first came from. Google Tag Manager can standardize and route important website events. GA4 can capture what the customer did between acquisition and conversion. Forms can preserve campaign and source information when an anonymous visitor becomes a known lead. The CRM can carry that information through the sales process. The transaction or financial system can attach actual revenue back to the customer record.
The important part is not any one tool. It is the connection between them.
A customer should be traceable from the original campaign to the website visit, from the visit to the form submission, from the form to the CRM record, and from the CRM record to the transaction and revenue that followed.
Once that chain exists, the business no longer has to infer relationships from separate reports.
It can measure them.
Better Tracking Changes What the Ad Platforms Learn.
This also improves how advertising platforms are managed.
Many businesses optimize campaigns around weak signals such as form submissions because that is the last point they can reliably track.
But not every form submission becomes a good customer.
If the CRM and revenue systems can send better outcomes back into the advertising platforms, the business can begin optimizing around stronger signals such as qualified leads, real customers, and revenue value.
That means Google Ads and Meta are no longer being trained simply to find people who are likely to fill out a form. They can be trained toward the kinds of customers who are more likely to create actual business value.
That is a very different use of the same advertising budget.
The Goal Is to Make the Analysis Repeatable.
This project required multiple exports, manual matching, validation, and recalculation as additional sources were introduced. That process was useful because it exposed where the measurement system was breaking down.
It should not become the permanent operating model.
The longer-term opportunity is to build the connections into the system itself so the same questions can be answered continuously rather than reconstructed months later.
Consistent campaign tracking, standardized events, reliable customer identifiers, complete CRM records, and connected revenue data can turn a one-time forensic analysis into a repeatable management tool.
Marketing can see which campaigns create valuable customers. Sales can see where the strongest opportunities originate. Leadership can understand how acquisition contributes to revenue. Finance can evaluate the economics of growth with more confidence.
And instead of five reports describing five different parts of the business, everyone can work from the same customer journey.
The Bigger Lesson
The most important insight was not hidden inside a complicated formula.
It was hidden between the systems.
Each report showed one piece of the business. The value came from connecting those pieces closely enough to understand how customers moved from acquisition to revenue.
Once that happened, several of the numbers changed.
That is the difference between having data and actually understanding what is driving the business.